Product Experiments
Case studies, frameworks, and writing samples.
CLASS SQL Framework
Overview
A 5-step, plain-English method I use to turn messy questions into clean, defensible SQL and clear, decision-ready outputs.
Purpose
Make analytics work fast, accurate, and explainable by guiding stakeholders (and myself) through a consistent sequence from question → data → filters → math → output.
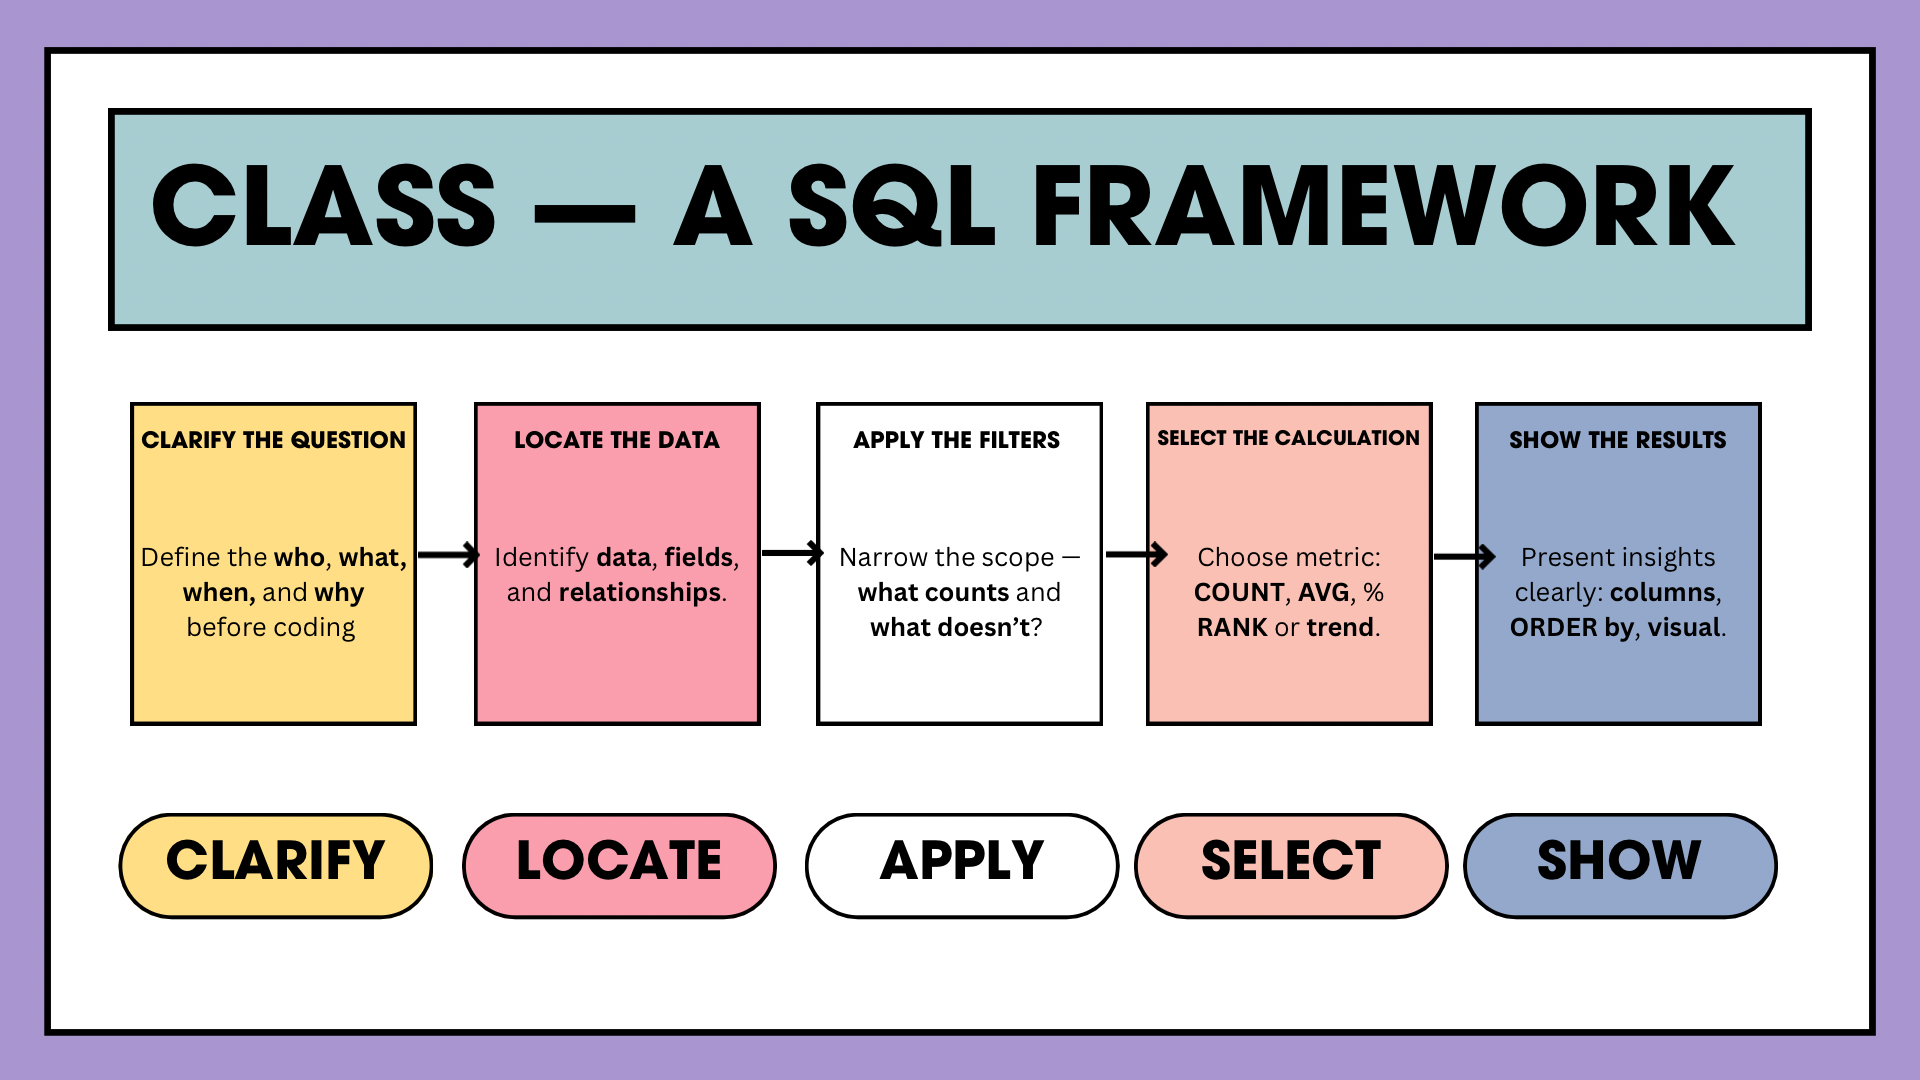
The Framework (CLASS)
C — Clarify the Question
What exactly are they asking? “Per student? Per grade? Per school? Which timeframe? Which subject?”
L — Locate the Data
Which table(s)/files contain the fields you need? Identify keys, grain, and joins.
A — Apply the Filters
Which rows count? (e.g., Math only, last school year, scores > 70, active students)
S — Select the Calculation
What math answers the question? (COUNT, AVG, SUM, % growth, rank, trend)
S — Show the Results
How should it be presented? (columns, labels, sort, top/bottom N, grouping)
Quick Checklist (copy/paste before you query)
- Clarify: metric, population, timebox, comparison?
- Locate: tables, keys, join types, grain?
- Filter: includes/excludes, null rules, business rules?
- Calc: formula, edge cases, rounding?
- Show: column names, sort order, totals, constraints?
From question to answer — fast, accurate, explainable.
Example (K-12 assessment use case)
Ask: “Which elementary schools improved average Math proficiency year-over-year?”
- C: Compare SY2023 vs SY2024, elementary only, proficiency = score ≥ 70.
- L:
students,assessments,schools,school_years. - A: subject = ‘Math’, grades IN (K-5), school_year IN (2023, 2024).
- S: AVG(score≥70) as proficiency_rate; calc change = 2024 − 2023.
- S: Show school_name, 2023_rate, 2024_rate, delta; sort by delta DESC; top 10.
**SQL sketch:**

```sql
WITH base AS (
  SELECT
    s.school_id,
    sy.year,
    AVG(CASE WHEN a.score >= 70 THEN 1.0 ELSE 0.0 END) AS proficiency_rate
  FROM assessments a
  JOIN students st ON st.student_id = a.student_id
  JOIN schools s  ON s.school_id = st.school_id
  JOIN school_years sy ON sy.id = a.school_year_id
  WHERE a.subject = 'Math'
    AND st.grade IN ('K','1','2','3','4','5')
    AND sy.year IN (2023, 2024)
  GROUP BY s.school_id, sy.year
),
pivot AS (
  SELECT
    b2023.school_id,
    b2023.proficiency_rate AS rate_2023,
    b2024.proficiency_rate AS rate_2024,
    (b2024.proficiency_rate - b2023.proficiency_rate) AS delta
  FROM base b2023
  JOIN base b2024
    ON b2023.school_id = b2024.school_id
   AND b2023.year = 2023 AND b2024.year = 2024
)
SELECT sc.school_name, rate_2023, rate_2024, delta
FROM pivot p
JOIN schools sc ON sc.school_id = p.school_id
ORDER BY delta DESC
LIMIT 10;
```